


XRP/USDT is a trading pair representing Ripple’s XRP token against Tether (USDT), a stablecoin pegged to the US dollar. XRP is a fast, low-cost cryptocurrency designed primarily for cross-border payments and is widely used by financial institutions. It runs on the RippleNet network, which enables near-instant transfers. The XRP/USDT pair is popular among traders for its liquidity and volatility, making it suitable for both short-term trades and long-term investment strategies.
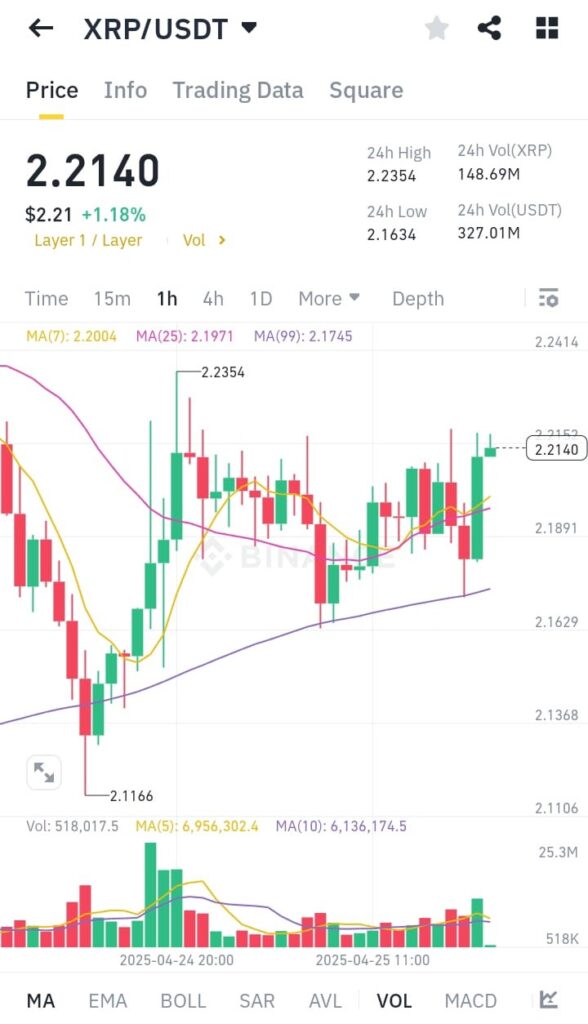
Technical Analysis of 1 hour Graph
Key Details:
Current Price: $2.2016
24h High/Low: $2.2281 / $2.1634
MA Levels:
MA(7): $2.1702
MA(25): $2.2459
MA(99): $0.9836 (way below current price — indicates strong long-term uptrend)
Technical Analysis of 1 Week Graph
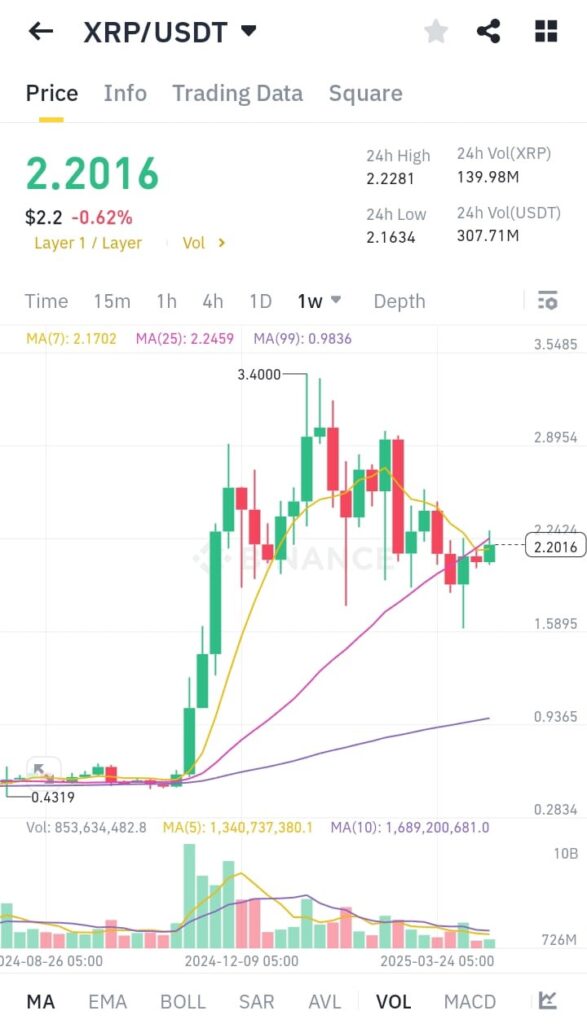
Key Detail:
MA(7) is above MA(99) — long-term trend is intact.
Price is bouncing near MA(7) — this often acts as a dynamic support.
Volume is not drying up, even though it’s lower than the peak around $3.40.
Caution Points:
Price is below MA(25) ($2.2459), suggesting medium-term resistance.
There was a clear rejection near $3.40, followed by several red candles, showing a cooling off period.
Candle wicks suggest indecision — bulls and bears are in a tug-of-war.
What This Means:
Above $2.25 (MA25), XRP could reattempt $2.60–$2.90.
If price breaks below $2.17 (MA7) and closes below it, we could retest support around $1.85 or even $1.58.
Holding above MA(7) is crucial this week — good spot for a cautious buy with tight stop if you’re bullish.
Technical Analysis of 1 Month Graph
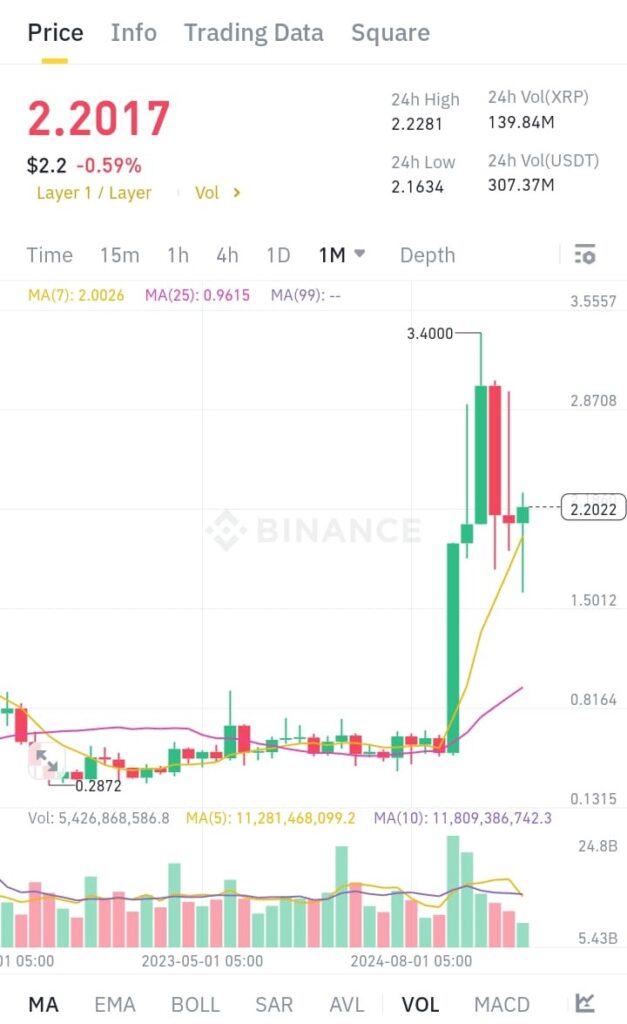
Key Data:
Current Price: $2.2017
24H High/Low: $2.2281 / $2.1634
MA(7): $2.0026
MA(25): $0.9615
ATH This Cycle (Monthly Candle): $3.4000
Volume Surge: Significant in the last few months, confirming strong interest.
Technical Analysis (1M Chart):
Bullish Indicators:
MA(7) > MA(25): Clear upward momentum, golden cross pattern forming on monthly.
Current candle holding above MA(7) ($2.0026) — this is strong support now.
Massive green candles starting late 2024 → huge breakout from accumulation.
Price is consolidating above the previous resistance zone of $1.50 — flipping resistance into support.
Warning Signs:
The rejection from $3.40 left a strong upper wick → some heavy profit-taking or whale selling.
The last few candles show a potential lower high forming — early sign of momentum slowing down.
Volatility is increasing — large candle bodies/wicks, which could mean we’re entering a redistribution phase unless bulls regain strength.
Big Picture:
This move resembles a parabolic phase, followed by consolidation.
As long as XRP holds above $2.00, it remains bullish in the macro view.
A monthly close above $2.25–$2.30 would confirm strength for another leg up.
Trading Strategy:
For Long-Term Position Holders:
Ideal Buy Zone: Between $1.85 – $2.00 (near MA(7))
Major Support Levels:
$2.00 (MA7 monthly)
$1.50 (horizontal support from breakout level)
Resistance Targets:
$2.60 (intermediate)
$3.40 (recent high)
$3.90+ (long-term breakout)
Stop-loss Suggestion:
If you’re long-term: below $1.45 (below key structure)
Would you like me to blend this monthly outlook with your weekly and hourly chart for a full-tiered strategy (short-term entries with long-term targets).
Perfect! Let’s combine monthly, weekly, and hourly views for a layered XRP/USDT strategy — this helps align short-term trades with long-term trend direction.
Multi-Timeframe Analysis – XRP/USDT
1M (Monthly) – Macro Outlook
Trend: Bullish momentum with early signs of consolidation
Key Support: $2.00 (MA7), $1.50
Key Resistance: $2.60, $3.40, $3.90+
Bias: Long-term bullish as long as $2.00 holds
Strategy: Accumulate dips near $2.00–$1.85 for long-term hold
Looking for monthly close above $2.30+ to confirm strength
1W (Weekly) – Medium-Term View
Trend: Slight recovery, but still below key MA(25)
Price: $2.2016
MA(7): $2.1702 — acting as dynamic resistance
MA(25): $2.2459 — resistance zone
Structure:
Recent bounce from $1.58 suggests bulls are defending hard.
Weekly candles show buying pressure but also hesitation.
Strategy:
Look for a breakout above $2.25 (MA25) to enter swing longs.
As long as we’re under $2.25, consider smaller position sizes.
Watch for pullbacks to MA(7) for low-risk entries
1H (Hourly) – Short-Term Entry Zone
(Based on latest image: the chart shows breakout attempts around $2.20)
Momentum: Neutral to slightly bullish
Price Range: $2.16 (support) – $2.23 (resistance)
Intraday Setup:
A breakout above $2.23 with volume = quick scalping opportunity toward $2.28+
Dips to $2.16–$2.17 could offer scalping buys with tight stops
Confirmation:
Look for MA crossovers (e.g., MA9 > MA25) on 1H as a bullish signal
Use RSI or MACD on 1H for timing
Trade Plan Example:
| Type | Entry Range | Target | Stop-Loss | Notes |
|---|---|---|---|---|
| Long-term Hold | $1.85–$2.00 | $3.40 / $3.90 | $1.45 | Accumulate dips |
| Swing Trade | $2.26–$2.30 | $2.60 / $2.85 | $2.10 | Wait for breakout |
| Short Scalps | $2.16–$2.18 | $2.22 / $2.28 | $2.12 | Watch hourly chart |