SUI Crypto Currency
SUI is a next-generation Layer 1 blockchain and smart contract platform developed by Mysten Labs, designed for high scalability and low-latency applications. Built using the Move programming language, SUI focuses on fast transaction processing, low fees, and enhanced security. It introduces a novel approach to consensus, allowing for parallel execution of transactions, which significantly improves performance compared to traditional blockchains. SUI is ideal for use cases like gaming, decentralized finance (DeFi), and digital asset ownership, making it a strong contender in the evolving Web3 ecosystem.
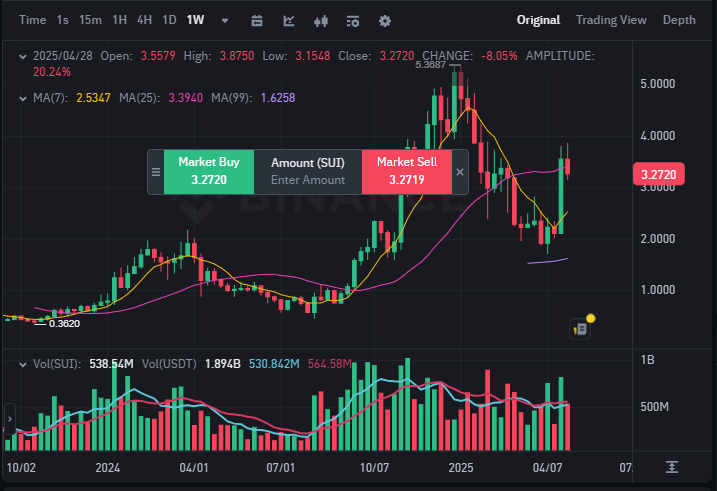
SUI One Week Graph Analysis

The weekly chart of SUI shows significant volatility over the past year, with a notable bullish rally that peaked around $5.39 earlier in 2025. After reaching this high, the price entered a strong corrective phase, dropping to a low near $1.15 before attempting a rebound. As of the latest candle (week ending April 28, 2025), SUI closed at $3.2720, down 8.05% for the week. Despite this drop, there appears to be a short-term recovery underway, as the price has moved above the 7-week moving average (MA7 at ~$2.53) and is approaching the 25-week MA (MA25 at ~$3.39). The increased volume in recent weeks, especially green volume bars, suggests a possible accumulation phase. However, the price faces resistance near the 25-week MA, and a break above this level could signal a continuation of the upward momentum. Conversely, failure to hold above $3.00 could expose SUI to further downside risk.
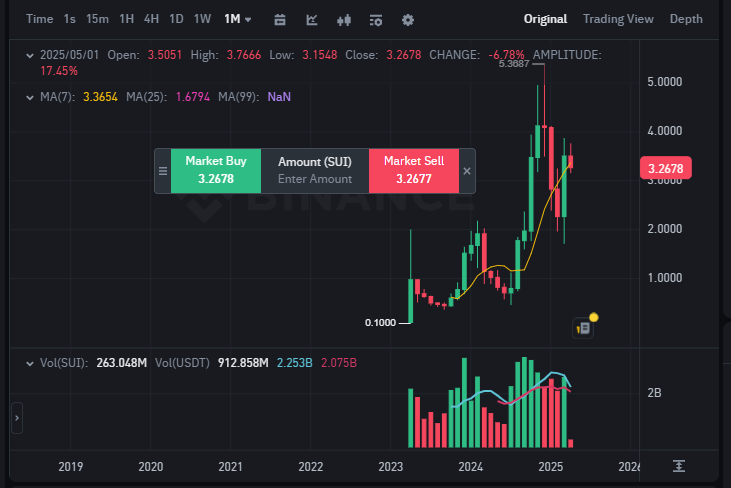
SUI One Month Graph Analysis

The monthly chart of SUI displays a broader perspective of the cryptocurrency’s market behavior since its listing. After launching at around $0.10, SUI experienced a sharp surge, reaching a peak of approximately $5.39. However, this parabolic rise was followed by a significant correction. The current candle for May 2025 shows a red body, with the price opening at $3.5051 and closing at $3.2678, representing a 6.78% decline for the month so far. Despite this, SUI remains above the 25-month moving average (MA25) at $1.6794, and is currently near the 7-month MA ($3.3654), indicating it is testing a key resistance zone.
Volume has slightly declined compared to the earlier bullish months, suggesting a possible slowdown in momentum. However, the price remains significantly above previous lows, pointing to potential consolidation or a reaccumulation phase. If SUI can maintain support above $3.00 and break convincingly above $3.50, it may resume upward movement. Otherwise, further rejection at this level could lead to another downward correction.
Should We Buy it Now?
No,
Reasons to Avoid Entry Now:
Key Resistance Zone Unbroken:
SUI is struggling to break above the $3.35–$3.50 resistance level on both the weekly and monthly charts.
Price rejection from this zone could trigger another downward leg.
Bearish Candlestick Formation:
Both recent weekly and monthly candles show bearish closes, indicating sellers are currently stronger than buyers.
High Volatility Risk:
SUI has shown large swings (e.g., from $1.15 to $5.39 and back), which can lead to unexpected price moves and stop-loss hits.
Volume Divergence:
On the monthly chart, declining volume with rising price (previous months) often suggests a weakening trend or lack of conviction among buyers.
Macro Uncertainty or Altcoin Weakness:
If broader market sentiment (especially Bitcoin or Ethereum) turns bearish, SUI could drop further regardless of its individual setup.
SUI has shown strong historical bullish momentum since its launch, peaking around $5.39. However, recent charts reflect a period of correction and consolidation.
Monthly View: After a strong recovery from lows, SUI is now facing resistance near the $3.36–$3.50 range, as seen in the May 2025 candle. The price has declined by 6.78% so far this month, forming a red candle that signals hesitation among buyers. It remains above the 25-month MA (~$1.68), which is a longer-term bullish sign, but the upward momentum appears to be stalling.
Weekly View: The price rebounded from a key support zone near $1.15 and is currently attempting to break above the 25-week MA (~$3.39). Volume is rising, and the candles show a shift from bearish to bullish sentiment. However, last week closed with an 8.05% drop, suggesting sellers are still active near resistance.
Trading Strategy:
Short-Term (1–4 weeks):
Buy zone: $2.80 – $3.00 (support level & retracement zone)
Target 1: $3.60 (near-term resistance)
Target 2: $4.20 (if breakout continues)
Stop-loss: Below $2.50
Mid-Term (1–3 months):
Accumulation zone: $2.50 – $3.00 (consider gradual entries)
Target: $4.50 – $5.00 (if bullish trend resumes)
Watch for: Breakout above $3.50 with strong volume as a confirmation signal
Risk Note:
SUI is still in a post-rally consolidation phase. Failure to break above $3.50 in the near term may lead to retesting lower supports near $2.50 or $2.00. Monitor volume and moving average crossovers for trend confirmation.

 China
China Russia
 India
India


