


Floki Crypto Currency
Floki (FLOKI) is a cryptocurrency that originated as a meme coin inspired by Elon Musk’s Shiba Inu dog, Floki. Launched in June 2021, it has since evolved into a multifaceted Web3 ecosystem encompassing decentralized finance (DeFi), non-fungible tokens (NFTs), and a metaverse platform.
Origins and Community
Initially created by an anonymous developer who later abandoned the project, Floki was revitalized by its community, known as the “Floki Vikings.” This passionate group has been instrumental in driving the project’s growth, leveraging social media campaigns and community engagement to promote adoption.
Ecosystem and Utility
Floki operates on both the Ethereum and Binance Smart Chain networks, adhering to ERC-20 and BEP-20 standards, respectively. Its ecosystem includes several key components
Valhalla: An NFT-based metaverse game where players can earn rewards through gameplay.
FlokiFi: A suite of DeFi products, including the FlokiFi Locker, which allows users to lock and vest tokens securely.
FlokiPlaces: An NFT and merchandise marketplace facilitating the trade of digital and physical goods.
University of Floki: An educational platform aimed at providing crypto-related content and resources.
Tokenomics
Floki has a total supply of 10 trillion tokens. A 0.3% transaction tax is applied to each purchase, which is allocated towards the development and expansion of the Floki ecosystem.
Charitable Initiatives
Beyond its technological endeavors, Floki is committed to philanthropy. The project has pledged to build schools in underdeveloped nations, with completed projects in countries like Nigeria, Guatemala, Laos, and Ghana.
Market Position
As of now, Floki is traded on various decentralized exchanges and has garnered a significant following. However, like many cryptocurrencies, it remains subject to market volatility and regulatory scrutiny. For instance, its advertising campaigns have faced investigations and bans in certain jurisdictions due to concerns over promoting unregulated financial products.
Floki One Day Analysis
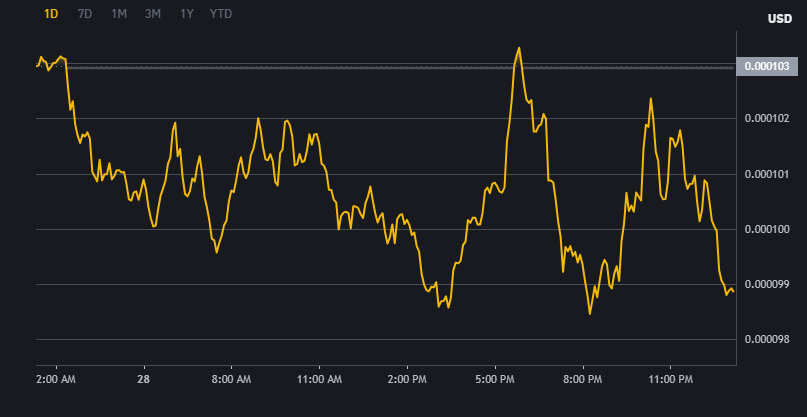
The 1-day price chart for Floki (FLOKI) shows a pattern of intraday volatility with multiple sharp fluctuations, indicative of active speculative trading and short-term market reactions. The price started the day slightly above $0.000103 but quickly dipped, forming a descending pattern in the early morning hours. This was followed by a series of short-term rallies and pullbacks between 6:00 AM and 2:00 PM, reflecting attempts by buyers to regain control, though none sustained significant momentum.
A notable recovery occurred around 5:00 PM, where the price sharply spiked, reaching the day’s high at approximately $0.000103 again, suggesting strong buying interest or possibly reaction to a catalyst such as news or whale activity. However, this rally was short-lived, followed by a steep decline around 7:00 PM, and the market continued exhibiting choppy movements into the late evening.
By the end of the day, the price retraced back to below $0.000099, forming a lower low relative to the day’s open, indicating bearish pressure. Overall, the chart reflects a lack of clear trend direction, with the asset showing signs of both bullish attempts and strong sell-offs. This suggests uncertainty and possible distribution behavior, where traders are actively rotating in and out of positions rather than holding for longer-term gains. Caution is advised for short-term traders, with close attention needed on support levels around $0.000098 and resistance near $0.000103.
Floki One Month Analysis
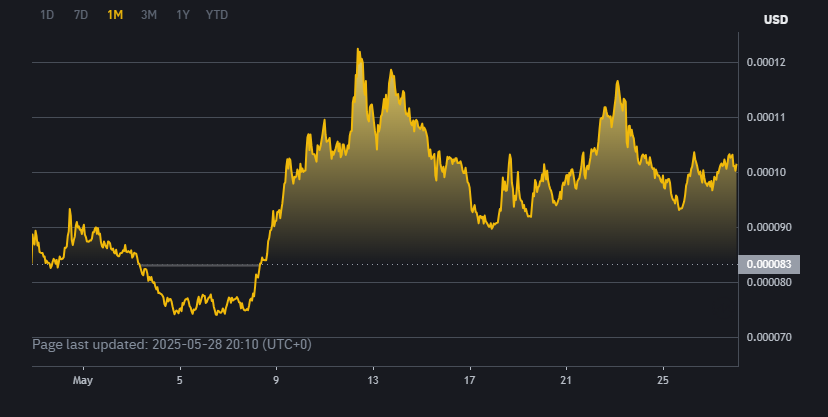
The 1-month price chart of Floki (FLOKI) presents a classic example of a mid-term accumulation and breakout pattern followed by high volatility. At the start of May, FLOKI experienced a gradual downtrend, reaching a local bottom around May 6–8 near the $0.000080 support level. This support held firm through repeated tests, suggesting strong buyer interest at that zone. Following this consolidation, a bullish breakout occurred around May 9–10, leading to a sharp upward rally that peaked close to $0.000120 around May 13. This marked the monthly high and represents a nearly 50% gain from the recent bottom — a strong signal of bullish momentum entering the market.
However, the surge was met with heavy resistance, triggering a correction phase. The price then entered a volatile range, fluctuating between $0.000090 and $0.000110, with multiple short-term tops and bottoms forming throughout mid to late May. This suggests a period of profit-taking and indecision, with bulls and bears battling for control. Notably, the higher lows during the pullbacks indicate underlying strength and potential continuation of the broader uptrend.
Currently, the price appears to be stabilizing around the $0.000100 zone, attempting to establish it as a new support. If this level holds, another upward breakout toward the $0.000115–$0.000120 resistance range is plausible. On the downside, a breakdown below $0.000090 could expose the price to another test of the critical $0.000080 support. Overall, the chart shows bullish structure development, but the high volatility implies traders should monitor key levels closely and consider risk management in short- to mid-term positions.
.